


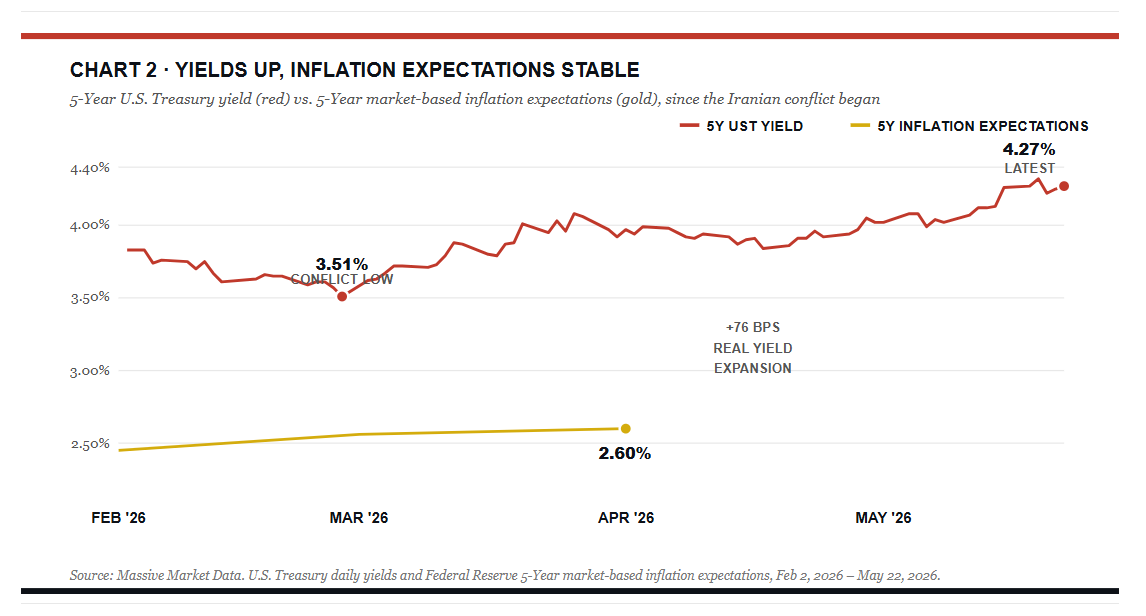
Yesterday’s Commentary led with a discussion of how bond yields have risen far more than bond market-implied inflation expectations. The fear of another inflation spike is negatively impacting bonds more than should be expected given implied inflation. While worrying about inflation, bond investors are not considering consumer confidence and how weaker economic activity due to higher prices could push inflation and bond yields lower.
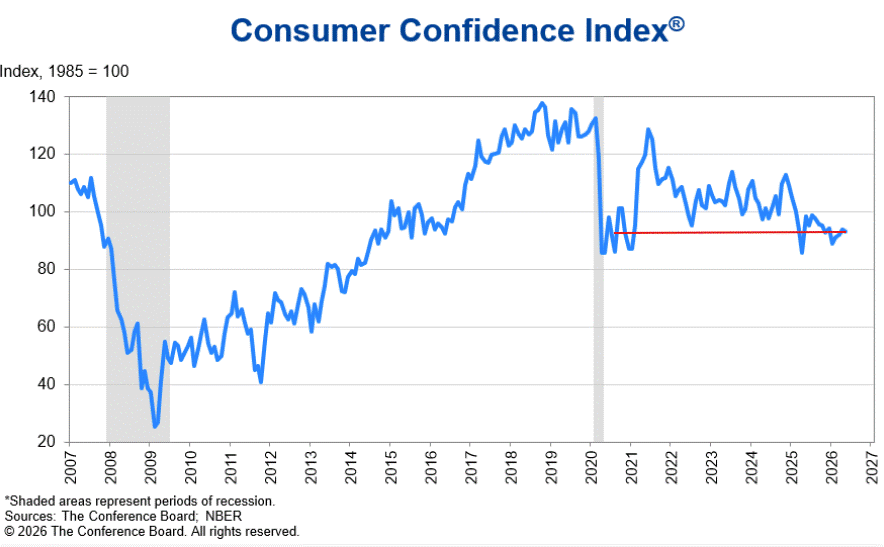
The Conference Board Consumer Confidence Survey, released on Tuesday, shows that consumer confidence has been slipping and sits just above the Pandemic troughs. The war and higher prices are certainly undermining confidence which will likely negatively impact personal consumption. To wit, the survey asked, “How have you changed your overall spending habits due to rising prices? ” 66. 5% of respondents answered: “I am cutting back on spending overall. ” Regarding other special questions, 60% said they were buying fewer items, and 50% said they were delaying purchases of expensive items. Moreover, 46% are buying the same things in cheaper versions, and the same percentage are buying more things they need than they want.
The overarching point being that consumers seem to be changing their spending habits in ways that will put pressure on prices and corporate margins. The bond market is failing to consider that inflation is likely transitory and due almost entirely to the Iranian conflict but not considering that there will likely be a negative economic impact, which should have a disinflationary effect.
While the current inflationary narrative bodes poorly for bonds, the facts as we shared in yesterday’s Commentary and the implications of weak consumer confidence argue that yields are too high. The normalization of oil prices, coupled with weaker demand for many goods and services, should push bond yields back to or below their pre-war levels.
Market Trading Update
The volume of emails this week boiling down to “what breaks this rally” tells me a lot about where sentiment sits. Eight straight weekly gains. The Shiller CAPE is near 40. Speculative appetite has spilled into options flow, single-stock momentum names, and crypto. Yesterday’s commentary made the historical case that 8-week streaks resolve positively 92% of the time over the next year. That doesn’t mean the rally can’t pause. It doesn’t mean the next pullback won’t hurt. It means the bear case has to compete with a very strong base rate.
So what actually ends a rally like this one? Three things, and “high valuations” is not on the list.
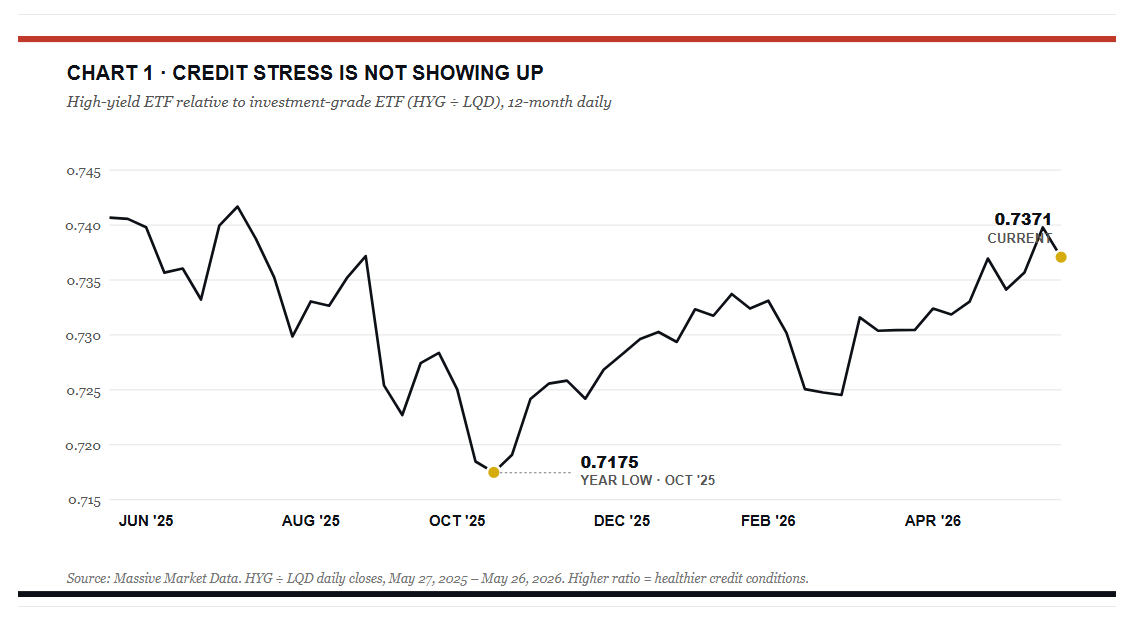
The first is a credit event. Rallies don’t die because P/E ratios are stretched. They die when funding costs spike, spreads blow out, and the marginal buyer pulls his bid. Watch high-yield spreads and the 2s-10s curve. As long as credit behaves, equity drawdowns tend to be shallow and bought.
The second is a Fed policy shock. The market is currently pricing in further easing before year-end. Any signal from the Fed that the inflation impulse from the Iranian conflict is structural, not transitory, would force a violent repricing. We flagged that dynamic in yesterday’s piece on the gap between real yields and inflation expectations. So far the bond market believes the conflict premium is temporary. If it doesn’t, equities will reset.
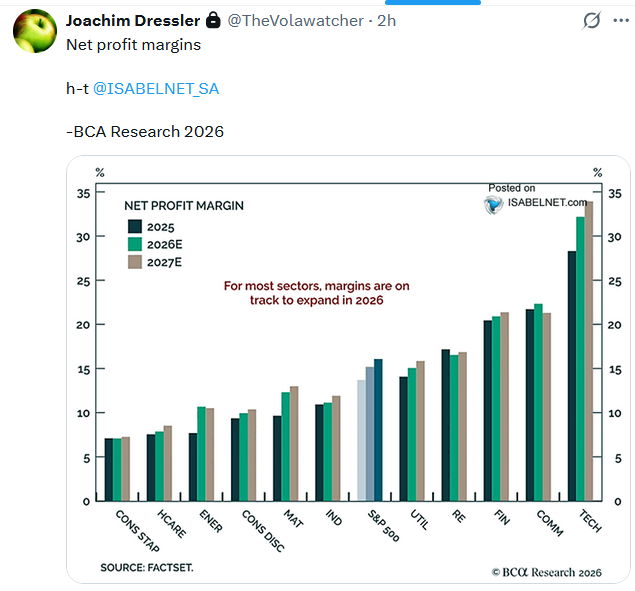
The third is an earnings reset. Bullish markets tolerate stretched multiples as long as the “E” keeps growing. The moment forward estimates start getting cut, the math turns ugly fast at a 40 CAPE. So far, estimates are still drifting higher.

“Eight up weeks is the wrong moment to put new money to work at the index level. It’s also the wrong moment to capitulate the other way and sell what’s working. ”
Steps To Trade An Unbreakable Rally
1. ) Don’t chase. Eight up weeks is the wrong moment to put new money to work at the index level. The one-week forward return in this setup averages negative, and entries here have historically come at a reward-to-risk you wouldn’t accept in any other context.
2. ) Don’t panic out either. The data we reviewed yesterday is clear. Pullbacks from these signals get bought. Selling everything because the tape feels frothy is the bigger mistake, and we have eleven of twelve historical cases that say so.
3. ) Do the unglamorous work. Trim outsized winners back to target weights. Raise a 5% cash cushion if you don’t already have one. Tighten stops on speculative positions. Refresh your shopping list of names you’d happily buy 10% lower.
Make no mistake, this rally has earned the benefit of the doubt. The way to participate without getting caught is the same way it always has been. Stay disciplined, stay liquid, and let the next setup come to you.
Economic Forecasting
One of the more popular questions we’re asked is which Fed GDP forecast is more reliable, the Atlanta Fed’s GDPNow or the New York Fed’s GDP Nowcast. The answer is that there is no correct answer. The two models compute their forecasts differently, and depending on the economic environment, one model can have an advantage over the other.
GDPNow mimics the Bureau of Economic Analysis’s (BEA) own calculation methodology and data inputs to calculate GDP’s 13 subcomponents. Think of their method as a running GDP figure, with each new data point updating the model. That’s both its strength and weakness. Early in a quarter, when data is limited, a single economic data point can swing the estimate dramatically. However, later in the quarter, GDPNow begins to more closely track actual GDP.
The NY Fed Nowcast estimate takes a different approach. They draw on a broader dataset that extends beyond BEA inputs. Thus, early in a quarter, it does a better job of smoothing the estimate as it has more data. The result is a less volatile reading, but one that tends to be less accurate by quarter-end.
The graphic below shows that GDPNow is currently estimating 4% GDP growth in the second quarter, while the Wall Street consensus is sub 2%. The New York Fed Nowcast model is at 2. 61% with a wide range of possible GDP figures. Not shown, but the St. Louis Fed Nowcast model is more in line with Wall Street at 1. 98%. While the output is wide-ranging, it should be noted that we are only a little more than halfway through the quarter, and the data for April hasn’t been fully released yet. It would be like trying to predict the score of a football game after the first quarter.

AI Productivity And Innovation: Prosperity Or Engels Pause- Part 2
The bullish and bearish cases for AI’s economic impact are not mutually exclusive. History suggests that both can be true simultaneously. Productive innovations that ultimately raise living standards broadly have frequently done so only after extended periods of disruption and concentrated gains.
Our base case remains that AI productivity will prove net positive for the economy and most of the population over time. The productivity gains are real, the capital investment is unprecedented, and history’s verdict on innovation is consistent. But the timeline of how and when the benefits of AI innovation are distributed is far from known.
For investors, the timeline should play an integral role in managing their wealth.

Tweet of the Day
“Want to achieve better long-term success in managing your portfolio? Here are our 15-trading rules for managing market risks. ”