


It occurred to me after one of my recent commentaries that there was just a bit of additional perspective subscribers will find helpful. I have 2 charts below. Takeaways:
1. This chart shows 1 year “rolling returns. ” This helpful type of performance analysis is overwhelmingly ignored by Wall Street, probably because it doesn’t fit their sales narrative. The purple line plots the return (of the S&P 500 ETF, in this case) monthly. But the returns are not cumulative. Instead, each point on the chart is a 1 year (12 month) time frame.
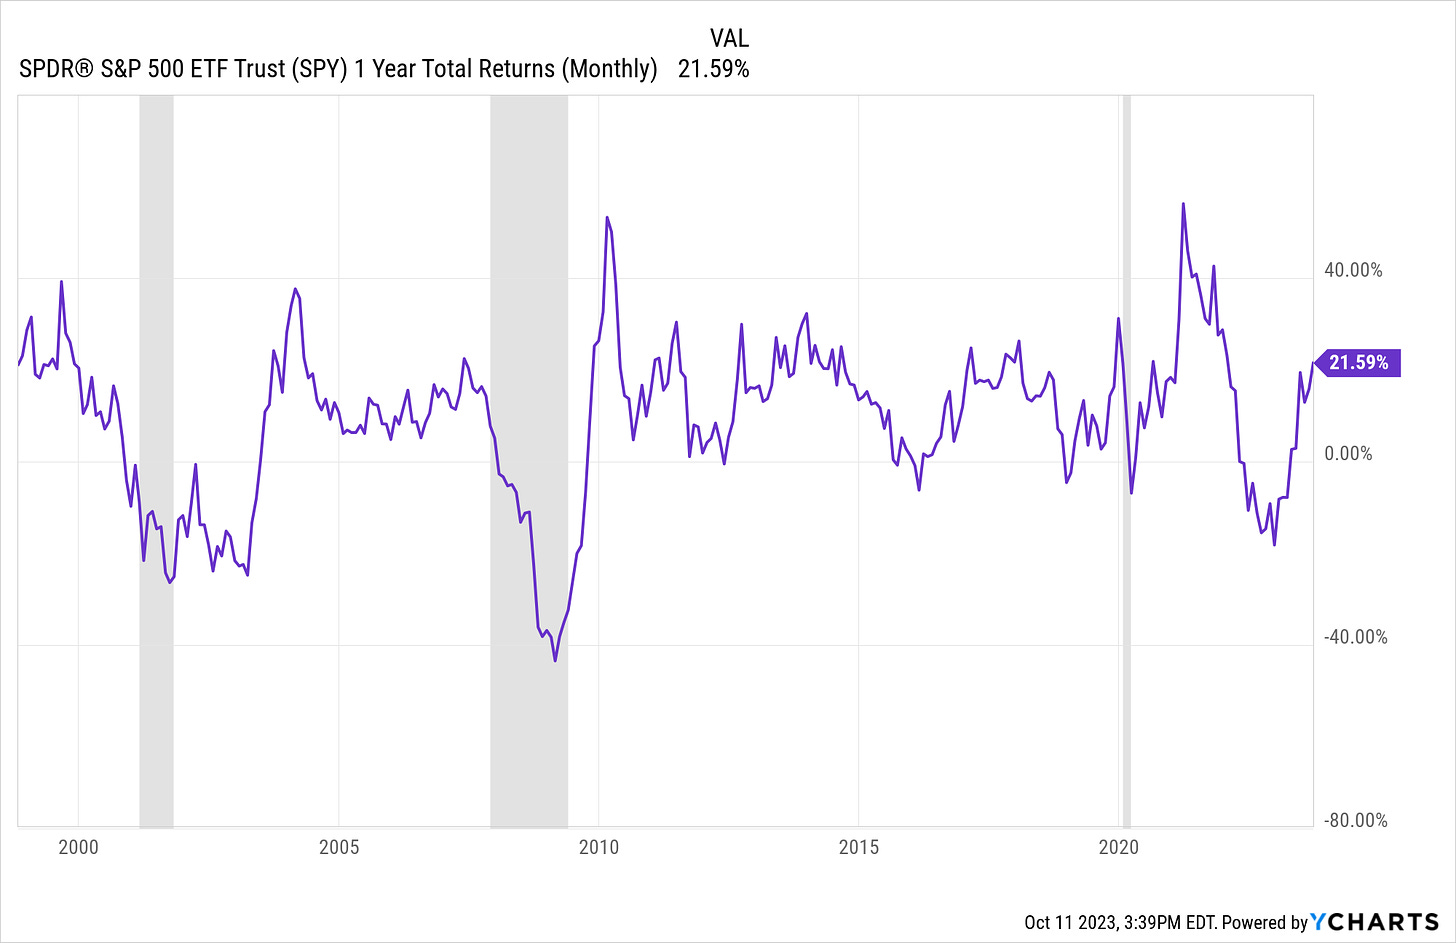
If all we do when analyzing past performance is look at a single, static time period, it is like watching 15 seconds of a movie and concluding we know all about the film. I created this chart to answer the question, “based on history, what’s my best/worst case investing in the S&P 500 for 12 months? ” This is essentially how I start looking at any decision, just with different time frames involved.
In the chart above, I see that a long time ago, before 2010, the stock market’s return over any 12-month period varied widely, as much as 40% up OR down.
Then, we had a period of, shall we say, bliss. From 2010 through 2022, there were hardly any 1-year periods where the S&P 500 didn’t make a profit. And 20% gains in 12 months was common. A lot of over-confidence was created during this period.

Photo by Tech Daily on Unsplash
2. Now, here’s the same chart, but focused only on 2021, 2022 and so far this year. We’ve seen not only a huge range of potential outcomes (up 55% to down 20%), but there has been no calming period. It has been feast or famine. This is a small period of time, but it speaks to how things changed when the “free money” economy stopped.
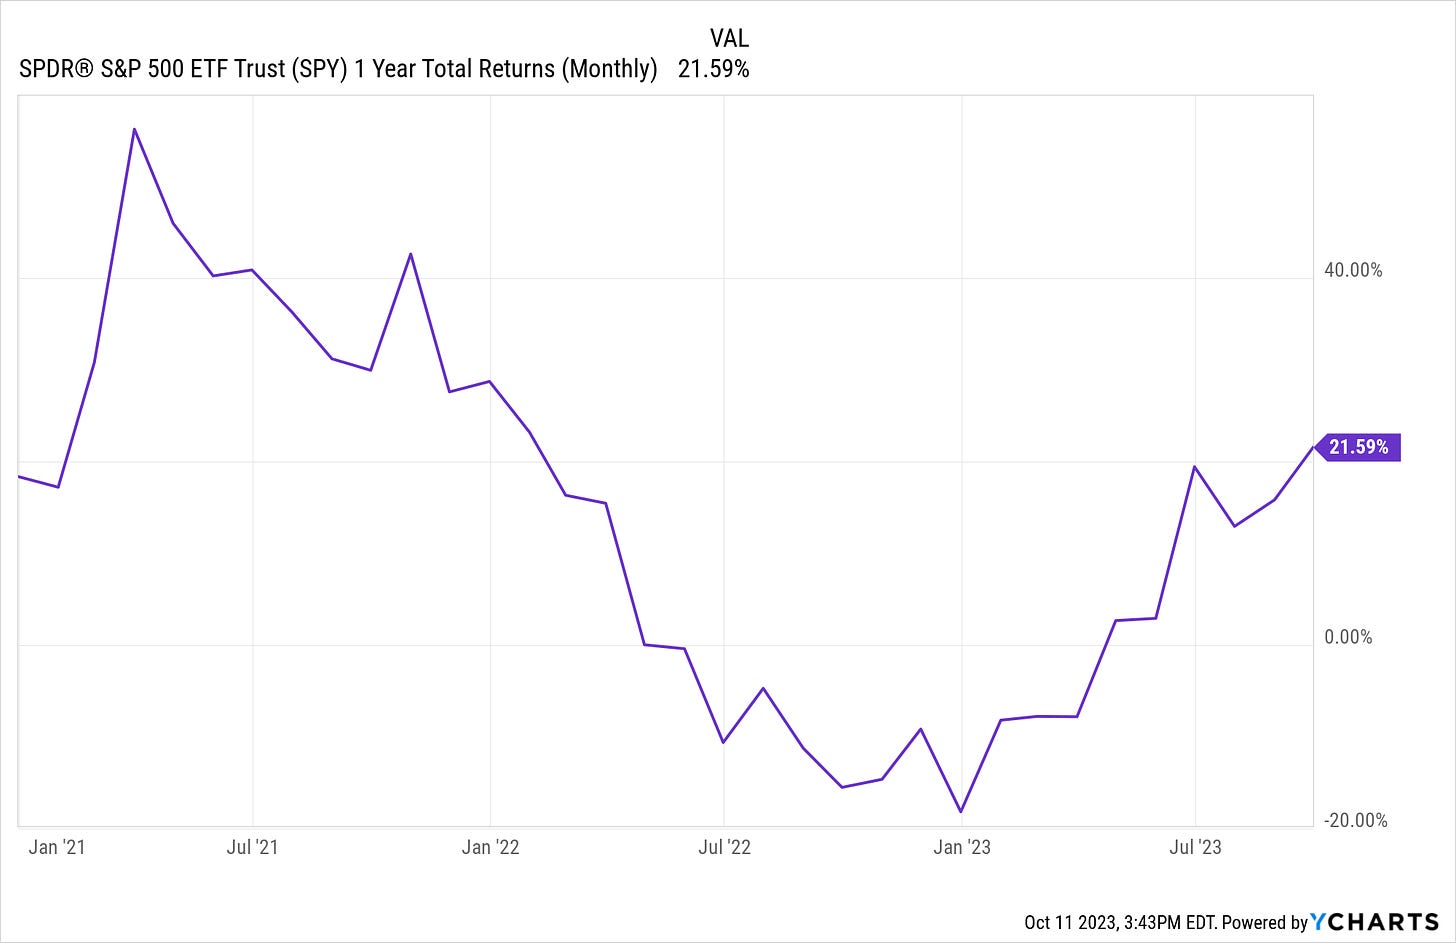
This is all to say that investing has entered a new era. Returns will be more of a grind, and investors will and should be tempted to take the gift of 5% T-bill rates and use it as a '“show me” position. That is, don’t drive yourself nuts trying to fill a portfolio with “stuff” at a time when returns are harder to come by, and cash yields are 4-5% above where they were during much of that 2010-2021 period. They were not far above zero for much of that time.
I hope this is another helpful piece of investing education as I continue to communicate some of the “bread and butter” techniques that go into the decision-making system I’ve developed over the past 30 years. More on the way soon.