


The One Big Beautiful Bill Act (OBBA) is expected to support economic growth by boosting personal consumption through sizeable increases in federal refunds to households. While this is supportive for consumer spending, this coincides with one of the largest increases in energy, gas, and utility costs American households have faced since 2022, offsetting much of that windfall.
As a result, investors are curious if this war-driven increase in oil prices could spur an energy investment cycle through equipment orders, oilfield services employment, and manufacturing; a reasonable assumption given the US is now a net exporter of energy potentially helping boost profits while supporting broader economic activity. However, after years of challenged earnings growth, energy companies are likely to focus on profits over production.
How refiners make money: the crack spread
Refiners purchase crude and sell refined products at higher prices. The standard profitability measure is the 3-2-1 crack spread1. With the average price of gasoline and diesel at $3. 98/gal and $5. 35/gal, respectively, today’s crack spread is approximately $50/bbl— triple the ~$16/bbl long-term average. These are exceptional margins, and refiners are responding by hedging forward to lock in profits rather than betting on persistence.
How drillers make money: WTI vs. breakeven costs
For upstream producers, profitability is the oil price minus drilling costs. According to the Dallas Fed Energy Survey, breakeven for new Permian Basin wells are roughly $69/bbl (Midland) and $63/bbl (Delaware). The Eagle Ford break even near $63/bbl, with the Bakken and deepwater Gulf of America ranging from $65–75/bbl. At $92 WTI, every major basin is well above breakeven. The economics strongly favor drilling.
Profits over production—for now
But favorable economics do not automatically produce more barrels. When crude exceeded $100 post-Russia/Ukraine, crack spreads topped $60/bbl, yet the production response was modest. As mentioned, ramping up production can take anywhere from three to nine months, and companies are reluctant to commit that capital and fear losing credibility by breaking budget guidance to chase prices if the spike appears potentially short-lived. Moreover, capital discipline remains entrenched, directing cash flows toward dividends and share buybacks—a posture reinforced after several years of uneven earnings heading into this spike.
Altogether, the base case is that energy companies will lock in profits rather than materially ramp up production. While we could see modest increases in production as the administration seeks to refill the Strategic Petroleum Reserve (SPR) via forward contracts, that will take time. For investors, this means higher energy prices are likely to support near term profitability for the sector, but unlikely to provide a significant economic boost from energy investment.
Profitability remains strong across drillers and refiners
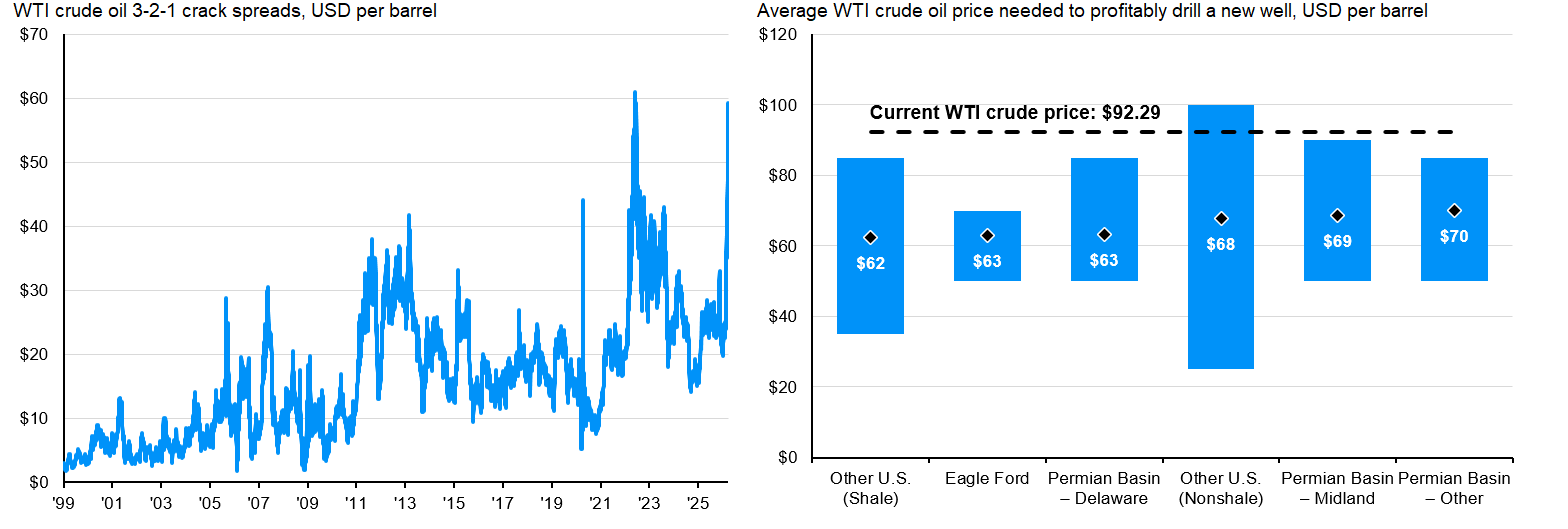
Source: J. P. Morgan Asset Management; (Left) Bloomberg, NYMEX; (Right) Federal Reserve Bank of Dallas.
(Left) Crack spread calculated based on the front month futures contract and is derived using the following formula after contract units are adjusted: (((Gasoline price*2) +(Diesel price*1)) - (WTI crude price*3))/3. Since crack spreads are derived using futures, the crack spread calculated using the spot rates mentioned in this article may differ. (Right) Diamonds annotate the average WTI crude price needed for new wells to be profitable while the bars represent the range of responses. Executives from 80 exploration and production firms answered this question during the survey collection period, March 11–19, 2026.
Data are as of March 24, 2026.
1 3-2-1 creak spread = (2 × gasoline + 1 × diesel – 3 × crude) ÷ 3, in dollars per barrel. Calculation based on front month futures contracts.
adc630f9-2780-11f1-9b05-a1e8122575b0